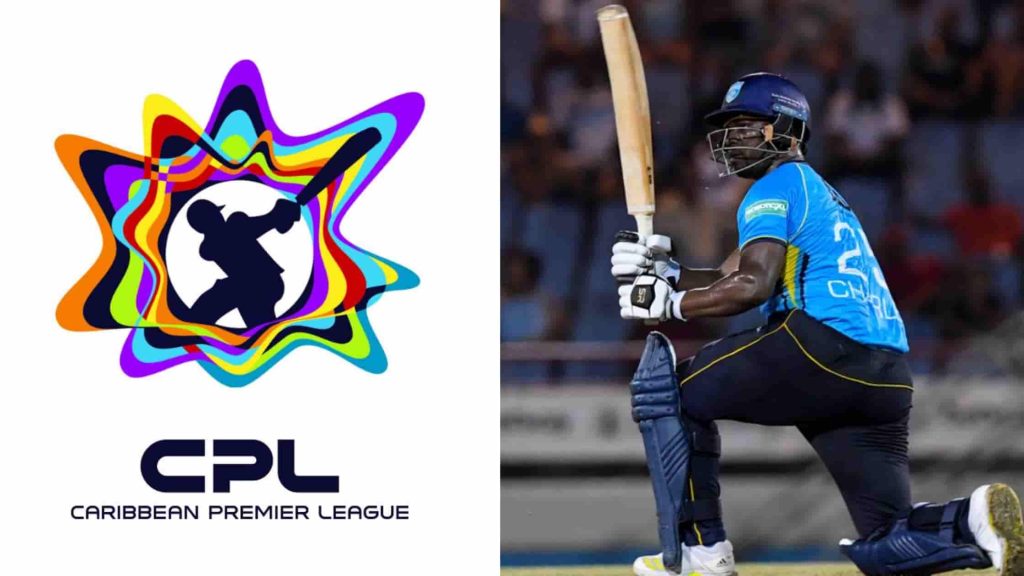
The Caribbean Premier League (CPL) has produced some of T20 cricket’s most explosive batting since its 2013 debut, and the race for most runs in Caribbean Premier League history tells a story that goes far beyond a simple leaderboard.
It’s a story of two very different kinds of run-scorers, the boundary-hungry six-hitters and the calculated accumulators who rotate strike and pick their moments.
This guide covers the full all-time run charts, but with a twist: instead of just listing numbers, we break down how each player got there, because two batters with 3,000+ CPL runs can have completely different games.
Who Has Scored the Most Runs in CPL History?
As of the 2025 season, Johnson Charles leads the all-time CPL run-scorers list with 3,519 runs, edging out Andre Fletcher (3,445) and Kieron Pollard (3,192). All three have been fixtures of the tournament since its inaugural year in 2013, giving them over a decade to build their totals.
Here is the complete table of the top 10 highest run-scorers in Caribbean Premier League history:
| Rank | Player | Teams | Span | Mat | Runs | HS | Avg | SR | 100s | 50s |
|---|---|---|---|---|---|---|---|---|---|---|
| 1 | J Charles | AHwks/BR/BT/JT/SLK/STARS/ZOUKS | 2013–2025 | 130 | 3519 | 94* | 28.60 | 131.94 | 0 | 23 |
| 2 | ADS Fletcher | SLK/STARS/STKNP/ZOUKS | 2013–2025 | 128 | 3445 | 93* | 29.95 | 122.55 | 0 | 21 |
| 3 | KA Pollard | BT/STARS/TKR | 2013–2025 | 138 | 3192 | 104 | 34.69 | 151.63 | 1 | 16 |
| 4 | N Pooran | BT/GAW/RedSt/TKR | 2013–2025 | 127 | 2873 | 102* | 29.61 | 149.09 | 3 | 17 |
| 5 | E Lewis | RedSt/STKNP | 2014–2025 | 113 | 2809 | 102* | 27.00 | 140.16 | 2 | 17 |
| 6 | C Munro | SLK/TKR | 2016–2025 | 92 | 2769 | 120 | 35.05 | 132.99 | 2 | 18 |
| 7 | LMP Simmons | GAW/JT/STARS/STKNP/TKR | 2013–2021 | 93 | 2629 | 97 | 31.67 | 119.71 | 0 | 20 |
| 8 | CH Gayle | JT/STKNP | 2013–2021 | 85 | 2519 | 116 | 36.50 | 133.13 | 4 | 13 |
| 9 | SO Hetmyer | GAW | 2016–2025 | 96 | 2269 | 100 | 28.01 | 140.40 | 1 | 15 |
| 10 | SD Hope | BR/BT/GAW | 2015–2025 | 80 | 2253 | 106 | 31.29 | 127.64 | 1 | 14 |
Mat = Matches, HS = Highest Score, Avg = Batting Average, SR = Strike Rate
The Angle Everyone Else Misses: Boundary Reliance vs. Running Between Wickets
Most “top run-scorers” articles stop at the table above. But the more interesting question for a real CPL fan is: how did these players score their runs? A batter who leans heavily on boundaries plays a different kind of innings than one who works the gaps and rotates strike.

By calculating the percentage of total runs that came directly from fours and sixes, a clear split emerges among the tournament’s leading run-getters:
- Evin Lewis — 74.1% boundary reliance. Nearly three-quarters of his runs come in fours and sixes, making him arguably the purest boundary hitter on this list.
- Chris Gayle — 71.0%. Unsurprising for the format’s most iconic six-hitter — the “Universe Boss” barely needed to run.
- Nicholas Pooran — 67.9%. Consistent with his reputation as a modern power-hitting finisher.
- Kieron Pollard — 66.1% and Johnson Charles — 66.3%. Both sit almost identically high, despite very different roles (finisher vs. opener).
- Colin Munro — 63.6% and Lendl Simmons — 62.8%. Slightly more balanced, mixing boundaries with strike rotation.
- Shimron Hetmyer — 60.6% and Andre Fletcher — 60.8%. Middle of the pack.
- Shai Hope — 55.5%. The clear outlier — the only top-10 run-scorer whose game is built more on placement and running than on clearing the ropes, which also explains his comparatively lower strike rate on this list.
Why this matters for fans: if you’re building a fantasy CPL team or just want to understand matchups, boundary-reliant players like Lewis, Gayle, and Pooran are more vulnerable to disciplined bowling on bigger grounds, while accumulators like Hope and Simmons tend to be more consistent across conditions.
Most Runs in CPL: Consistency vs. Explosiveness
Total runs only tells part of the story. Layering in average and strike rate reveals distinct player “archetypes” among the all-time leaders:
The Anchors (High Average, Longevity-Driven Totals)
- Colin Munro — highest average on the list at 35.05, despite fewer matches than most names above him.
- Kieron Pollard — 34.69 average with a genuine six-year peak of power-hitting.
- Chris Gayle — 36.50 average, still the highest of any player with 2,000+ CPL runs.
The Strike-Rate Kings (Explosive Impact Players)
- Kieron Pollard — 151.63 strike rate, the fastest scorer among the top 10.
- Nicholas Pooran — 149.09 strike rate, with three centuries in far fewer innings than most names above him.
- Shimron Hetmyer — 140.40 strike rate, the best among players outside the top 5 in total runs.
The Volume Scorers (Most Innings, Steadiest Presence)
- Johnson Charles — 127 innings, more than anyone else on this list, and the only player to pass 3,500 runs.
- Andre Fletcher — 125 innings, right alongside Charles across the same 2013–2025 window.
Century Makers Among CPL’s Top Run-Scorers
Only a handful of the competition’s leading run-scorers have converted starts into hundreds — a reflection of how T20 cricket rewards quick 30s and 40s over the long haul more than it rewards centuries:
- Chris Gayle — 4 centuries (most of any player on this list)
- Nicholas Pooran — 3 centuries
- Kieron Pollard, Colin Munro, Evin Lewis, Shai Hope, Shimron Hetmyer — 1–2 centuries each
- Johnson Charles and Andre Fletcher — remarkably, 0 centuries between them despite ranking #1 and #2 on the all-time run charts, underlining just how much their totals come from consistent fifties (23 and 21 respectively) rather than one-off big scores
Quick-Reference Facts for CPL Fans
- Most CPL runs overall: Johnson Charles (3,519)
- Highest score by a top-10 run-scorer: Kieron Pollard, 104
- Best average among top run-scorers: Chris Gayle (36.50)
- Fastest scorer (strike rate) among top run-scorers: Kieron Pollard (151.63)
- Most fifty-plus scores: Johnson Charles (23)
- Most centuries: Chris Gayle (4)
- Longest-serving run-scorer: Johnson Charles and Andre Fletcher, both active from 2013 to 2025
- Most “efficient” boundary hitter: Evin Lewis (74.1% of runs from boundaries)
- Least boundary-dependent top-10 scorer: Shai Hope (55.5% of runs from boundaries)
Who Could Break Into the Top 10 Next?
With Nicholas Pooran (2,873), Evin Lewis (2,809), and Colin Munro (2,769) all still within realistic touching distance of the top three, and Shimron Hetmyer climbing steadily since his 2016 debut, the CPL all-time run charts are far from settled.
Pooran in particular, with three centuries already and a strike rate near 150, has a real chance to challenge Charles and Fletcher for the top spot if he continues playing regularly in the tournament.
FAQs
Johnson Charles, with 3,519 runs across 130 matches between 2013 and 2025.
Colin Munro leads with an average of 35.05, narrowly ahead of Chris Gayle (36.50 — note Gayle’s average is actually the highest of the two, despite fewer total runs).
Chris Gayle, with 4 centuries, the most of any player among the all-time top run-scorers.
By strike rate, Kieron Pollard (151.63) and Nicholas Pooran (149.09) are the two fastest scorers in the top 10.
No — while Gayle remains iconic for the format, his CPL career ended in 2021, and Johnson Charles and Andre Fletcher have both since overtaken him on the all-time list.